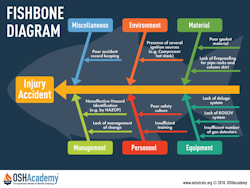
Fishbone Diagram
Another tool similar to the mind map is called the Fishbone Diagram or "Cause and Effect" Diagram.
Basically, it's just a mind map using a different form that reminds users of a fish with bones. The diagram has two sections: The effect and the causes.
- Effect. The "effect" is described using a problem statement. A problem statement might be: "Increased number of accidents in the maintenance department."
- Causes.
The "causes" are represented by the arrows and boxes. Generally, the cause categories might be personnel, materials, equipment, environment, management, and miscellaneous methods/procedures
As you can see in the diagram above, the large horizontal arrow pointing at the accident represents the surface cause(s) that directly caused the accident event. The six categories pointing to the surface cause arrow represent the possible root causes that might have somehow contributed to the accident.
Using the fishbone diagram is important because it forces the investigator to consider root causes, and the vast majority of accident investigations, when properly conducted, will uncover one or more root causes for an accident.
Knowledge Check Choose the best answer for the question.
6-6. Why is it a good idea to use the fishbone diagram when conducting accident investigations?
You forgot to answer the question!

